Opservatory 2.0 Has Landed 🚀posted Tuesday, August 18, 2026 by The Neighbourhoodie TeamCouchDBAnnouncementReleaseProductPerformance
We’ve offered a CouchDB diagnostics tool called “Opservatory” for quite a few years now to help make sense of your CouchDB monitoring and metrics data. Based on user feedback, plus the longstanding urge to update a beloved creation that will be familiar to many readers, we’re happy to announce a major overhaul in the form of Opservatory 2.0!
We’ve worked on making the app easier to set up and work with, plus overhauled the pricing model so that you can start using it with no fees at all.
Background
The Neighbourhoodie team has offered professional CouchDB product support and consulting for more than 12 years, with members of our team contributing to and working with the CouchDB project itself for more than 17 years. We’ve been able to help some of CouchDB’s biggest users, as well as teams just starting out with it.
Many teams had smooth-running metrics dashboards, like those Grafana and Datadog can help you create, but even grouped with those who didn’t, we saw a common pattern. Having a wealth of metrics and numbers is great and all, but how do you interpret them meaningfully and act on them efficiently?
Finding and resolving bottlenecks, spotting misconfigurations and their related tasks can be time-consuming even with substantial experience under your belt. Heck, sometimes we have a time of it! Wanting to help people solve this problem led to the genesis of Opservatory.
Why 2.0?
Based on feedback and, well, bluntly, our own ambitions for Opservatory’s usability, these are the reasons we wanted to overhaul and enhance the app:
- To make it easier to set up. We’ve replaced the previous one-pager of instructions with a much more user-friendly setup wizard that guides you through the process step-by-step. It’s much clearer and easier to follow, and also helps out with edge cases, like running your CouchDB in a docker container.
- To make it easier on the eyes. Opservatory was previously very “blocky”. Now, Opservatory’s visual design system reflects modern best practices for orchestrating hierarchy and distinguishing information categories.
- To lower the bar to entry. Opservatory used to cost 49 EUR per node per month, or was included free with every support contract. For people using CouchDB for prototypes or small private projects, that could be a little hefty over the course of a year. The base version is now free forever, and you can pay for add-ons that will become useful once you’re a heavy user. We love CouchDB, and we want to help people have an easier time with it.
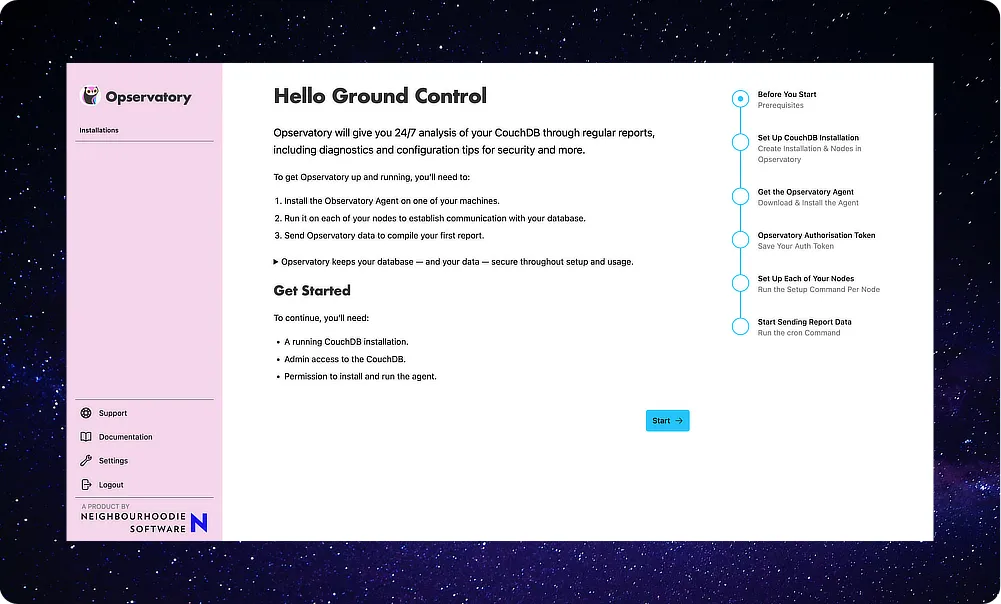
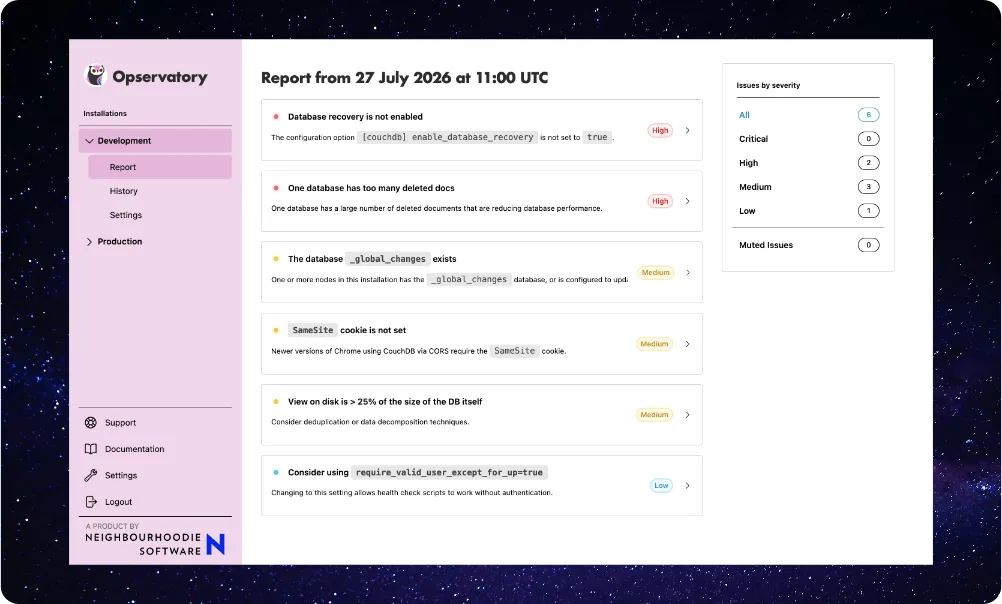
🔭 The shiny new Opservatory 2.0 has officially landed — you can sign up right now! 🚀
The Opservatory Foundations Are Still the Same
In case you’re completely new to Opservatory, here’s a little more information on what to expect. Opservatory consists of two parts:
The Opservatory Agent
- The agent is a small piece of Node.js software that you’ll download, install and run on each of your CouchDB nodes.
- It does not access or transmit anything to do with the contents of your database: in addition to not being that interesting for us, this would also go against common sense and the high security standards we hold ourselves to. Instead it transmits functional data and metrics about your CouchDB.
- Plus you get get to inspect the kind of data the agent sends to us before it happens. You are 100% in control.
The Opservatory App
- The app, which feels like any other web app, processes the agent’s payload into actional reports. You can configure what time you run these each day so you avoid overloading your system during high-peek usage.
- These reports are not probabilistically generated. Every piece of advice you receive inside of Opservatory was hand-crafted by our support team, along with the specific parameters to trigger it. You might have experienced the shortcomings of probabilistic automation — often misnomered “artificial intelligence” — when it comes to troubleshooting your database. Rest assured, Opservatory is going to react to your actual use case and CouchDB metrics, and not a conflation with nearby technologies.
Augmenting Monitoring Dashboards
As mentioned, we designed Opservatory to complement and not to replace or substitute your monitoring dashboard. We highly recommend you have your own metrics dashboard set up, and we have some tips for what to watch.
If you’d like a ready-to-go JSON to plug into Datadog, Grafana or something similar to bring your own dashboard to life in seconds for the CouchDB metrics and statistics we recommend keeping an eye on, give us a call or send us an email.
Join the Beta Program Now
We would love to have your feedback on deck — you can already sign up to be an Opservatory 2.0 beta tester. You’ll be able to use premium features at no cost as we develop them, and help us shape a tool that meets your needs.
We hope you’ll love using the new Opservatory as much as we’ve loved creating it!
« Back to the blog post overview